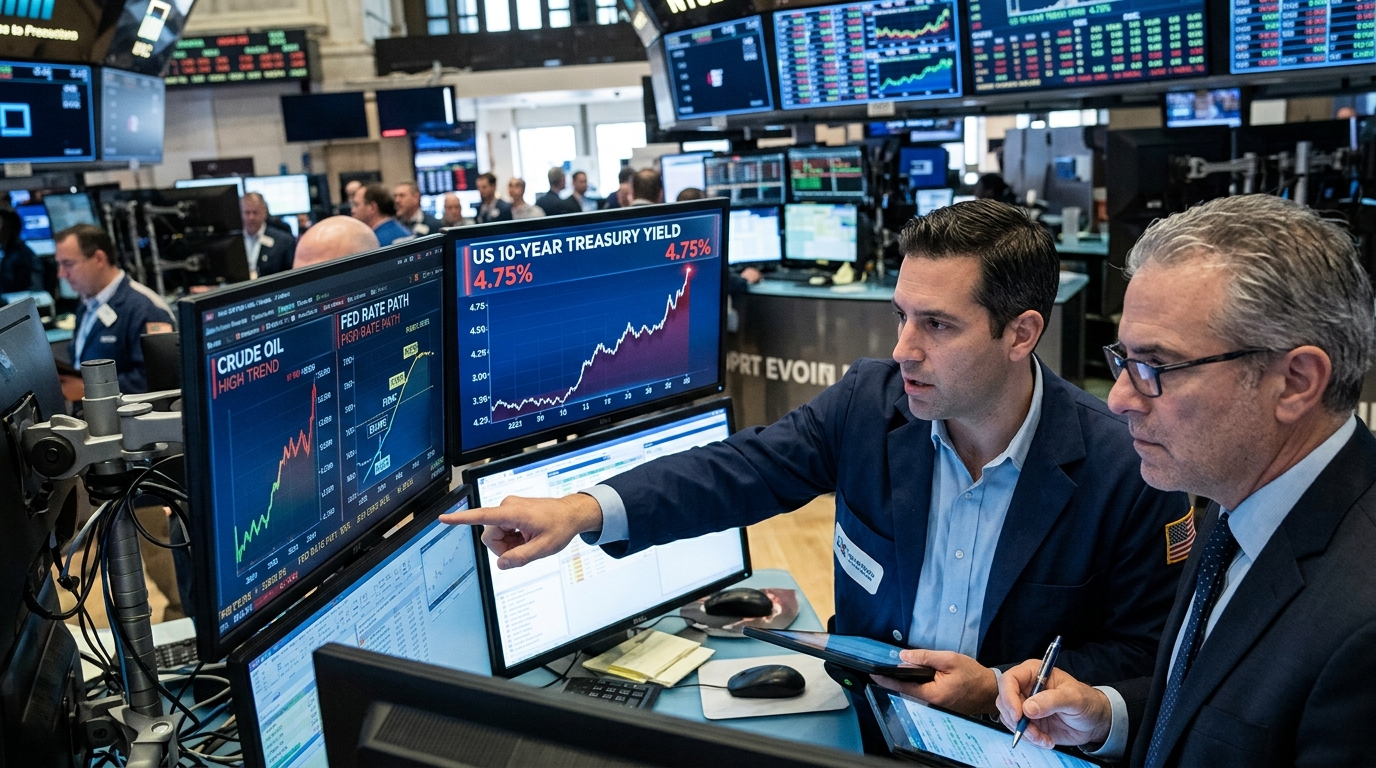
The 10-year Treasury yield breached 4.75% intraday Monday, its highest level since January 2025, and the move is not a clean technical story. It is a collision of three forces: a hawkish Fed chair, $90 crude, and a Treasury buyback expansion that does not arrive until September 9. The gap between now and then is where the risk lives.
Federal Reserve Chair Kevin Warsh’s Jackson Hole stance was unexpectedly hawkish, boosting market expectations for a rate hike next month. Traders of fed funds futures now see roughly a 60% chance of a quarter-point hike in September.
The buyback program itself is real, but its timing is the problem. The Treasury is increasing, by at least double, the size of liquidity support buyback operations for longer-dated nominal coupon securities in the 10-to-20-year and 20-to-30-year sectors, raising the per-operation ceiling from $2 billion to at least $4 billion. That change is effective September 9 and remains in effect through November 4. Before any of that hits the market, traders must navigate Friday’s August payrolls report, the August CPI release, and the September 15-16 FOMC meeting.
The 30-year yield topped about 5.33% in mid-August, the highest in nearly 20 years, amid a global bond selloff, the Iran conflict, fears of persistent inflation, and concern about U.S. borrowing as national debt approaches $40 trillion. Strategists at Barclays have attributed the rise less to inflation alone and more to the U.S. budget deficit, heavy issuance competing for capital, and higher term premiums investors are demanding to hold government debt.
What Another 25 Basis Points Does
TLT, the iShares 20+ Year Treasury Bond ETF, is the most direct expression of this trade. With a duration near 16 years, even modest increases in the 20-year or 30-year Treasury yield can erase months of income almost immediately. A 1% increase in rates can cause a double-digit percentage drop in NAV. A further 25-basis-point move from current levels would take TLT to levels last seen during the 2022 rate-hiking cycle.
Rate-sensitive equity sectors face the same arithmetic. Higher Treasury yields increase competition with equities, compressing the equity risk premium as bond yields approach earnings yields. Utilities and REITs, which recovered sharply in the first half of 2026, are now re-exposed. REITs had been resilient as a sector, but rates remain a key and difficult-to-forecast factor in the REIT outlook, inflation is still running above the Fed’s 2% target, and the market is pricing in possible rate hikes in the second half of 2026.
The Trading Plan
The asymmetry here favors the short side of duration. Bessent has signaled the buyback ceiling could go even higher, and those comments offered only a momentary check on climbing long-term yields before the move faded. The market is telling you something about conviction.
A sustained move above 4.75% would strengthen the technical case for a test of 4.809%, the January 2025 high, followed by 5.021%, the October 2023 peak. Support remains around 4.53%. Those are the levels that define the trade. A long TLT position only makes sense on a confirmed break back below 4.53% with payrolls softening materially. Above 4.75%, the path of least resistance stays higher until the buybacks land, September CPI surprises to the downside, or the FOMC explicitly abandons the hike option.
Watch Friday’s payrolls number as the first signal. The FOMC decision, expected September 16, has the potential to move the stock market significantly in either direction. The August CPI inflation data, released prior to the meeting, could shift expectations in either direction. That is a lot of event risk packed into a two-week window with no buyback cover until the ninth.